
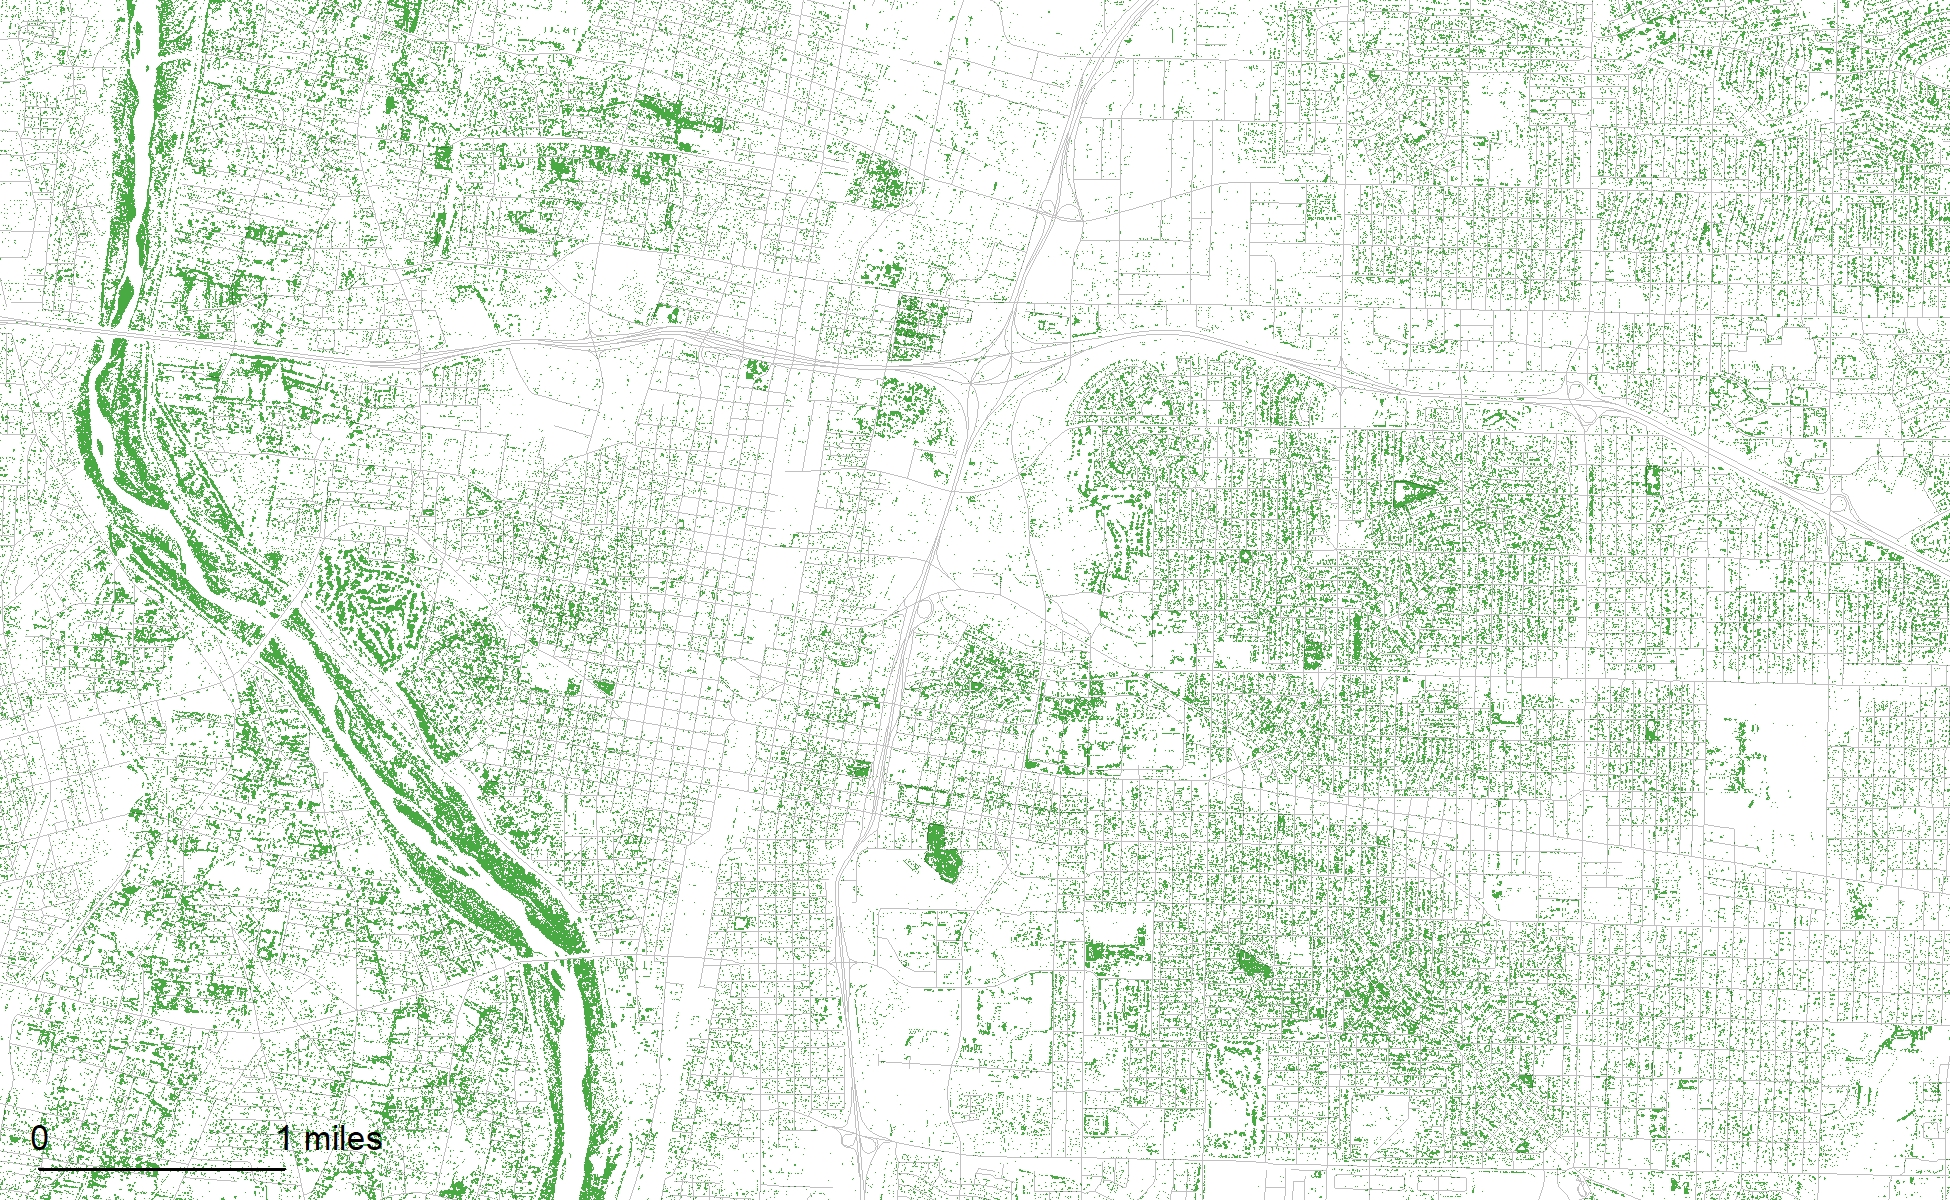
Albuquerque’s trees were mapped with 1-meter resolution aerial photographs taken in the summer of 2016.
Trees produce economic, social, health, and aesthetic benefits (Roy et al. 2012). Efforts are underway to increase the tree canopy in Albuquerque, New Mexico. Mapping the existing extent of tree canopy in the city will enable targeted investment in increasing canopy cover.
In this analysis, tree canopy was mapped from 4-band 1-meter resolution aerial photographs captured in the summer of 2016 by the National Agriculture Imagery Program (NAIP) using a Classification and Regression Trees (CART) classifier and hand digitized training data in Google Earth Engine (GEE). Canopy rasters and a poster featuring this data are publicly available.
Methods
To develop the training data points, NAIP imagery was downloaded for the study area from the USGS Earth Explorer database (earthexplorer.usgs.gov), then training points were manually digitized in ArcMap. The most recent NAIP imagery for the analysis area was captured over five days between 2016-06-14 and 2016-07-05. Image quality is generally high, with a few obvious breaks between image swaths.
Over 10,000 training data points were created. Training points were classified as either canopy (1) or not canopy (0). Training points were distributed across the study area with extra intensity in areas where the model was expected to have a more difficult time distinguishing between canopy and non-canopy, such as irrigated fields and shadows.
To provide more distinct bands for differentiating classes in the classification model, the NAIP imagery was processed in GEE. Besides the four bands collected in the NAIP imagery (infrared, red, green, and blue), normalized difference vegetation index (NDVI) and enhanced vegetation index (EVI) were also generated. Neighborhood entropy for each of the bands was calculated for a 4-pixel radius around each cell. These bands were then combined into a multi-band image to train the CART classifier.
The trained CART classifier was used to classify the multi-band image. The classification layer was then exported for cleanup in ArcMap. Four passes of a majority filter were used to remove artifacts from the classification process. Eight neighbors were evaluated in each pass with a replacement threshold of “half”.
To analyze the accuracy of the classification, a confusion matrix was created. The training data points were used as the ground truth and compared to the raw classification and cleaned classification datasets.
Results
Percent canopy cover for the entire study area is 11.4% for the cleaned classification and 13.2% for the raw classification. For the Albuquerque developed area excluding the Rio Grande Bosque, the canopy cover is 12.9%. The Bosque has a canopy cover of 47.5%. Including the Bosque, the Albuquerque developed area has a canopy cover of 13.7%.
The confusion matrix that compares the classification and ground truth of over 10,000 pixels indicates the original classification is more accurate than the cleaned data with an overall accuracy of 95.78% compared to 93.29% for the cleaned data (Tables 1 & 2). Even with its decreased accuracy, the cleaned classification data may be more useful for some applications, such as block-level maps where pixelated artifacts of the classification process may confuse map readers.

Table 1. Confusion matrix of the raw CART classification. Canopy is classified as 1, non-canopy as 0.

Table 2. Confusion matrix of the cleaned CART classification. Canopy is classified as 1, non-canopy as 0.
Discussion
NAIP imagery was selected from the available data sources due to its relative currency, high resolution, and high accessibility. LiDAR data has been collected for the Albuquerque metropolitan area but could not be processed in GEE. Satellite imagery is also available for more recent time periods and with higher spectral resolution but is only available at courser spatial resolutions.
The difference between the original and cleaned canopy models is due to small canopy areas being removed in the majority filter process. Small gaps in the canopy were also removed by the majority filter. The raw and filtered canopy rasters can be downloaded here.
Because the NAIP imagery for the analysis area was captured over five days, there are several regions that appear less saturated than the neighboring swath; in these areas canopy cover is predicted to be slightly lower than in the neighboring high saturation areas. These areas are most obvious northeast of the Sandia Mountains. The imagery covering the developed portion of the study area was collected on one day and doesn’t have apparent differences between image swaths.
About two thirds of errors are commission errors, where canopy is predicted but is not truly present. Commission errors are most prevalent in areas that are green but are not canopy, like edges of irrigated grass and green roofs where entropy is high. The limited spectral bands available from NAIP render these features indistinguishable from tree canopy. Additionally, the wide range of tree species in the study area also increase the range of underlying parameters in the canopy class. Everything from stressed piñon to irrigated orchards are trained as the same class despite significant differences in spectral appearance. Other non-canopy areas fall into these same ranges, especially deep shadows, green roofs, and the edges of fields. To further refine this analysis, LiDAR data could be used to remove areas classified as canopy that have zero relief above the ground surface. Omission errors are due to an under-trained model where the classifier does not recognize the cell as canopy. Additional training data could be added to improve the classifier.
References
Roy, Sudipto, Jason Byrne, and Catherine Pickering. 2012. “A Systematic Quantitative Review of Urban Tree Benefits, Costs, and Assessment Methods across Cities in Different Climatic Zones.” Urban Forestry and Urban Greening 11 (4): 351–63. https://doi.org/10.1016/j.ufug.2012.06.006.